Dynamic spreadsheets for data linking annotation
On the importance of data a lot has been said. We are living in the age of data where we produce constantly data by our presence online. At some point in your career or your studies, you may need to create your own dataset according to your field knowledge for a specific task. Such a dataset, which is technically called a gold-standard, is used as a collection of trustable instances for applying machine learning techniques and training neural networks. Amazon Mechanical Turk is one of the famous platforms which enables individuals and businesses create and annotate datasets through crowdsourcing.
Data annotation, as its name suggests, is the task of labelling data in various forms such as text, audio, image, video etc. In this post, one of the many functionalities of spreadsheets, particularly dropdown lists, for the task of data annotation is explored. I introduce a toy example of creating a dataset for sense linking using dropdown lists in spreadsheets. This example may not exactly fit into your case, but hopefully will give you a brighter idea of how much spreadsheets can be useful for annotating datasets instead of creating a program or a graphical interface.
This tutorial requires basic knowledge in using spreadsheets (Google spreadsheets) and also in JavaScript to use Google Apps Script. Google Sheet is a service provided by Google for working with spreadsheets. Apps Script is a JavaScript platform which makes manipulation and management of Google Docs, Sheets, Slides and Forms possible. In other terms, Google Apps Script is the programming language which uses your data on Google services.
Annotation description
Here is a toy example:
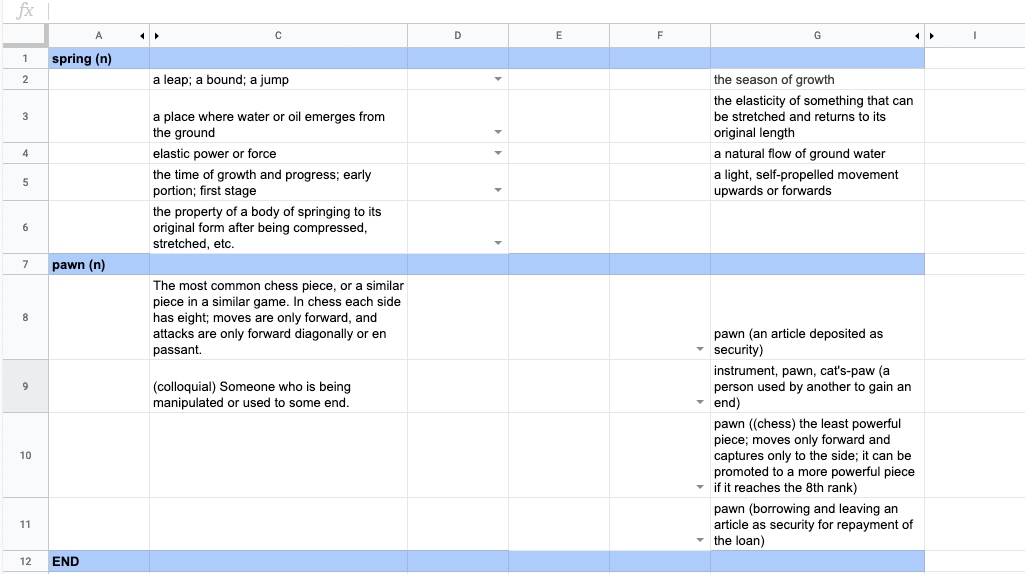
Suppose that you would like to create a gold standard dataset for a linking problem in a dictionary. We have two different sets of senses for the same entry in two dictionaries and the task of the annotators is to manually specify the corresponding senses. For instance, the senses of the word spring (noun) in Wiktionary and WordNet.
| spring: sense set 1 | spring: sense set 2 |
|---|---|
| a leap; a bound; a jump | the season of growth |
| a place where water or oil emerges from the ground | the elasticity of something that can be stretched and returns to its original length |
| elastic power or force | a natural flow of ground water |
| the time of growth and progress; early portion; first stage | a light, self-propelled movement upwards or forwards |
| the property of a body of springing to its original form after being compressed, stretched, etc. |
For this purpose, spreadsheets can be used efficiently by:
1- Converting our data into a tabular format in a spreadsheet
2- Add dependent dropdown lists automatically for facilitating annotation
Create a structure
As the first step, we define a structure for our data representation in the tabular form. I would suggest the following:
- column
A: headwords - column
B: IDs of the senses in the sense set 1 - column
C: senses in the sense set 1 - column
G: senses in the sense set 2 - column
H: IDs of the senses in the sense set 2
We leave columns D, E, and F for automatically adding information according to the senses as follows:
- column
D: if the longer sense set is located in columnC, then the dropdown lists appear in front of that column in columnD. Otherwise, columnDstays blank. - column
F: if the longer sense set is located in columnG, then the dropdown lists appear before that column in columnF. Otherwise, columnFstays blank. - column
E: left blank on purpose. Maybe you can add something there as an exercise?!
Our attention to the longer sense set is because of the fact that we want to annotate all the senses. If we only annotate the shortest sense set, we skip the other data which appear in the other (longer) set.
What we should keep in mind from the very first step is to create the spreadsheet based on a unique structure that allows us retrieve data correctly later. Setting IDs or specific symbols can be useful too.
Dependent dropdown lists
Now, we would like to add a dropdown list in the Sense match column in a way that for each headword, the available cells in the other side of the document appear in the dropdown list. This is dependent on the headword and the existing senses. Obviously, we cannot add such dropdown lists manually for a large dataset. Our solution is to create a simple function in Apps Script that does the job for us.
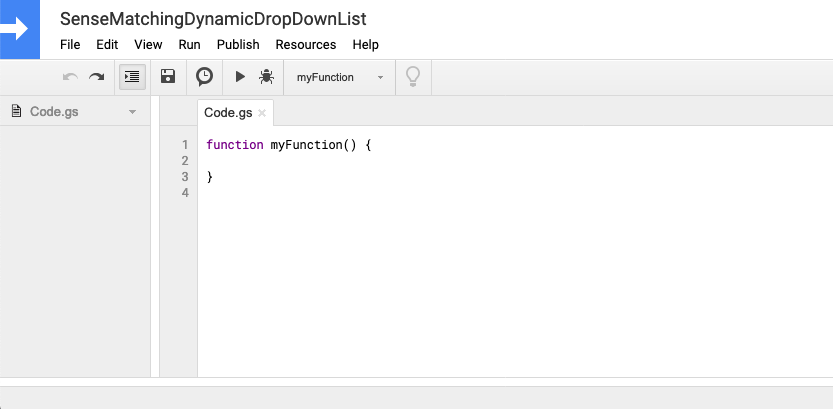
To use Apps Script for your spreadsheet, on your Google Sheet go to Tools > Script editor. In the new tab, you’ll have a text editor like the following where you can execute your code:
Let’s think about a solution to read the data and insert the dropdown lists in the right cells. Here is a strategy:
1- Find the location of the headwords in column A. To find the last headword, we put an “END” headword in the last row of the spreadsheet.
2- Calculate how many cells come between the headwords. That is how long your longer sense set is.
3- Find the side where the longer sense set is placed; in column C or G.
4- Insert the content of the shorter sense set in dropdown lists.
We call our function SenseDDLcreator.
function SenseDDLcreator() {
  var sheet = SpreadsheetApp.getActiveSheet();
  var data = sheet.getDataRange().getValues();
  var headwordIndices = [];

  // Find the location of the headwords
  for (var row = 0; row < data.length; row++) {
    if(data[row][0] !==  ""){
      headwordIndices.push(row);
      sheet.getRange(row+1,1,1,8).setBackground("#A3C4FA").setFontWeight("bold"); // blue #A3C4FA and green #93c47d
    }
  }

  var senseLength = 0;
  var longSenseSide = 0;

  for (var i = 0; i < headwordIndices.length-1; i++){

    // Calculate the length of the longest sense set for each headword
    senseLength = headwordIndices[i+1]-headwordIndices[i]-1;

    // Find the position of the longer list of senses by checking the last sense row of the headword in ODS (column C) or DDO (column G)
    if( (data[headwordIndices[i]+senseLength][2] !== "" && data[headwordIndices[i]+senseLength][6] !== "") || (data[headwordIndices[i]+senseLength][2] !== "" && data[headwordIndices[i]+senseLength][6] == "")){
      longSenseSide = 2;
    } else if(data[headwordIndices[i]+senseLength][2] == "" && data[headwordIndices[i]+senseLength][6] !== ""){
      longSenseSide = 6;
    } else{
      longSenseSide = 0;
    }

    // Extract sense IDs of the target set of senses
    var otherSenses = [];
    var validationRange = [];
    var senseMap = {2: 6, 6: 2};
    var matchMap = {2:4, 6:6}
    if(longSenseSide == 2 || longSenseSide == 6){
      otherSenses = data.slice(headwordIndices[i]+1, headwordIndices[i]+senseLength+1);
      for(var j=0; j < otherSenses.length; j++){
        if(otherSenses[j][senseMap[longSenseSide]] == "") break;
        validationRange.push(otherSenses[j][senseMap[longSenseSide]].toString().substr(0, 30));
      }
      // Insert the DropDown list in the correct place
      var validationRule = SpreadsheetApp.newDataValidation().requireValueInList(validationRange).build();
      sheet.getRange(headwordIndices[i]+2, matchMap[longSenseSide], senseLength).setDataValidation(validationRule);


      //Logger.log(validationRange);
    }
  }
  sheet.hideColumns(2);
  sheet.hideColumns(8);
}
And this is the magical output! The content of each dropdown list corresponds to the specificity of each headword.
To learn more about Google Apps Script, visit https://developers.google.com/apps-script/guides/sheets.
Last updated on 1 August 2019.